August 12, 2014
Tableau Tip: Creating a Connected Scatterplot
Alberto Cairo
,
connected
,
line
,
Lynn Cherny
,
scatterplot
,
tableau
,
the functional art
,
tips
,
twitter
No comments
Today I had the incredible honor of helping Alberto Cairo create his very first Tableau visualization. Alberto chose to create a connected scatterplot. Shortly thereafter on Twitter, Lynn Cherny asked:

So this post is dedicated to her question. Here you go Lynn:
Step 1: Create the scatterplot

Step 2: Change the Mark type to Line

Step 3: Add a continuous date dimension to the Path shelf

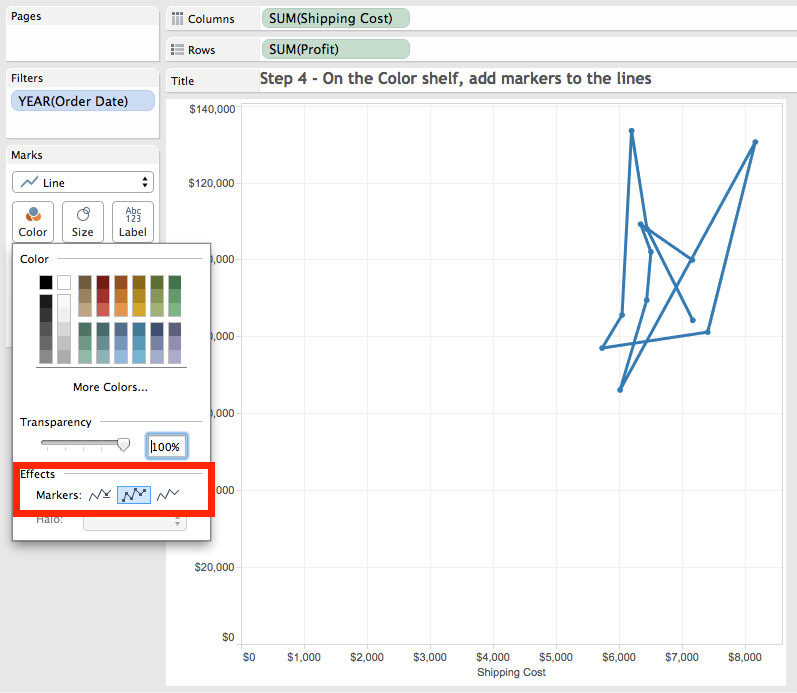
Step 4: Add Markers to the lines via the Color shelf
Step 5: On each axis, uncheck the "Include Zero" option

Step 6: Add a dimension to the Color shelf to create additional lines

That's all there is to it! Super simple! Download the sample workbook here.
Subscribe to:
Post Comments
(
Atom
)


No comments
Post a Comment