October 6, 2015
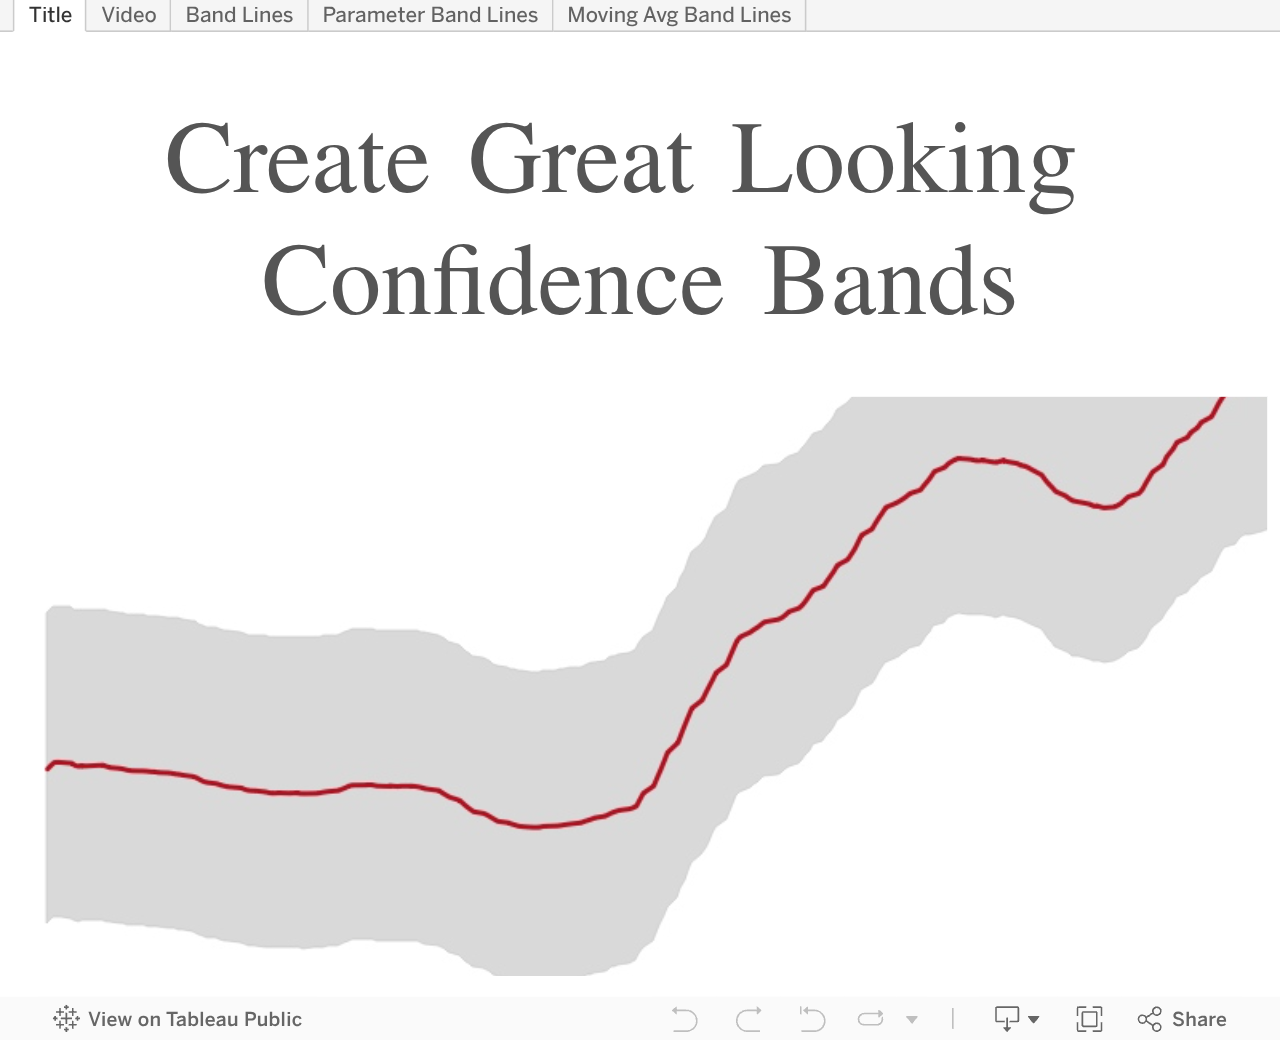
Tableau Tip Tuesday: Create Great Looking Confidence Bands

Back in February 2014 I wrote about creating Bollinger Bands. Today’s tip is a simplified, more practical version of this tip. This tip will help you to create bands lines that are quite visually pleasing to the consumers of your work.
In this video I focus on three topics:
In this video I focus on three topics:
- How to create confidence bands
- Using parameters to control the size of the confidence bands
- How to create a user-defined moving average based on a parameter
Subscribe to:
Post Comments
(
Atom
)


Thanks - banding is a nice add, especially for correlations. I had a bit of a hang up because I didn't catch the band width part the first time, so I still had upper band displaying. When you do that and change the mark type to area for the right axis Tableau stacks the values and your upper band ends up really really upper.
ReplyDeleteA quick rewind and I caught it the second time 'round.
Thanks!
Hi Andy. Thanks for posting this video. Such a big help. I'm trying to implement it for my set up and having a challenge. In your example, you are placing the upper and lower bounds on the secondary axis. Now, on my set up I am using Measure Values in my primary axis and plotting a line graph for three fields across time. I'm finding that with this set up, i don't have the option to add two fields to the secondary axis, rather only one field which is wierd.
ReplyDeleteCan you tell me why this is happening and what I can do to work around it?
Tableau only allows you to create a combined axis on one axis. I don't know of a workaround.
Deletehi Andy,
ReplyDeleteFor the Chelsea stat dashboard,just wonder how do you get the label in different color like white and black number format for 2014-15 and 2015-16 respectively?
Thanks
Cindy
Hi Cindy. You can download the workbook to see how I did it.
Delete