April 19, 2016
Tableau Tip Tuesday: Using LOD Calcs to Filter the Latest Month and View Sales for the Latest Day
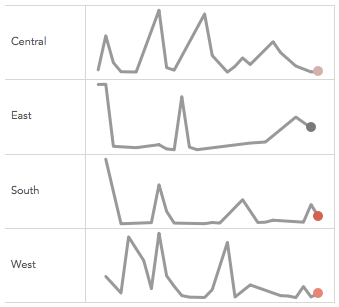
I’ve written before about making the ends of sparklines actionable here and here and created a video here. Each of these uses table calcs to add the dot on the end of the lines. The problem, though, is the method falls apart when the end date on all of the lines isn’t the same. Yes, there are other workarounds with table calcs, but they are overly complicated.
I’ve been wanted to look at this again with level of detail expressions, thinking there had to be a simpler way to create and maintain them, and a way to overcome the drawback listed above. The video below walks through two level of detail expression:
- Create a filter using a LOD calc to dynamically return just the latest month in the data set
- Return the value of the end of EACH line of a series of sparklines
This technique could easily be parameterized, but for this example, I stick to a single dimension. Enjoy!


